
Add What-if Assumptions to a Visual
Make assumptions for future data points.
Access requirements
Permission with these capabilities: Change Analysis Context
Reach out to your administrator for access.
- Access a What-if model by doing one of the following:
- Open a chart that contains a projection metric in Guidebooks.
- Select a projection metric in Explore.
For more information, see What-if Models.
-
On the Analysis Context toolbar, click the Add an assumption button
 .
. -
In the Add an Assumption dialog, select an assumption metric.
Tip:
- To view all assumptions for a model, click All Assumptions in the Categories pane.
- The Key Assumptions category contains assumptions that Visier experts believe should to considered when looking at the projected metric.
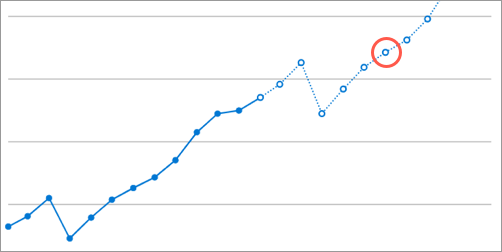
- Optional: If you added a Focused assumption, select a future data point that you want to make assumptions for.
You'll be creating assumptions for a specific population, which is defined by your selected data point. Your assumptions will be added on top of the time period, applied filters, and dimension members (For example, Canada, US, and Mexico are dimension members of the Location attribute) for the data point.
- In a Trend chart, future data points are indicated by a hollow circle.
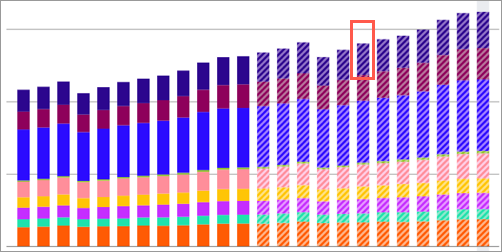
- In a Trend Breakdown chart, future data points are indicated by the hashed areas.
- In a Trend chart, future data points are indicated by a hollow circle.
- On the Analysis Context toolbar, hover over the assumption that you added.

Move the slider to the left to decrease the assumption value or move the slider to the right to increase the assumption value.
In the Assumption box, enter a new assumption value. You can hover over the Assumption box to see the range of values you can enter.
Result: A value is projected and the data point changes. Hover over the selected data point to see the projected value for the selected time period.
Note:
- If you enter an assumption value that is outside of the accepted range, the projected value will be calculated using the nearest accepted minimum or maximum value. The Assumption box will continue to show the value that you entered.
- Focused assumptions are applied to the dimensionality of the selected data point.
- In a Trend without a group by, the assumption is applied to the entire data point.
- In a Trend Breakdown with a group by, the assumption is applied to the specific segment that you selected.
- Repeat steps 2 to 5 to add additional assumptions using different assumption metrics for the selected data point or add assumptions for another future data point
- Optional: Save the set of assumptions as a scenario. Scenarios allow you to revisit and compare different assumptions. For more information, see Create a What-if Scenario.
Limitations
Assumptions cannot be made in the following situations:
- If the What-if analysis is too complex to project.
- If the Others data item is selected as your projected data point.
- If the applied filters or group bys in your chart include a group. Groups are custom sets of attribute values that allow you to quickly slice and dice your data. For more information, see Groups and Key Groups.